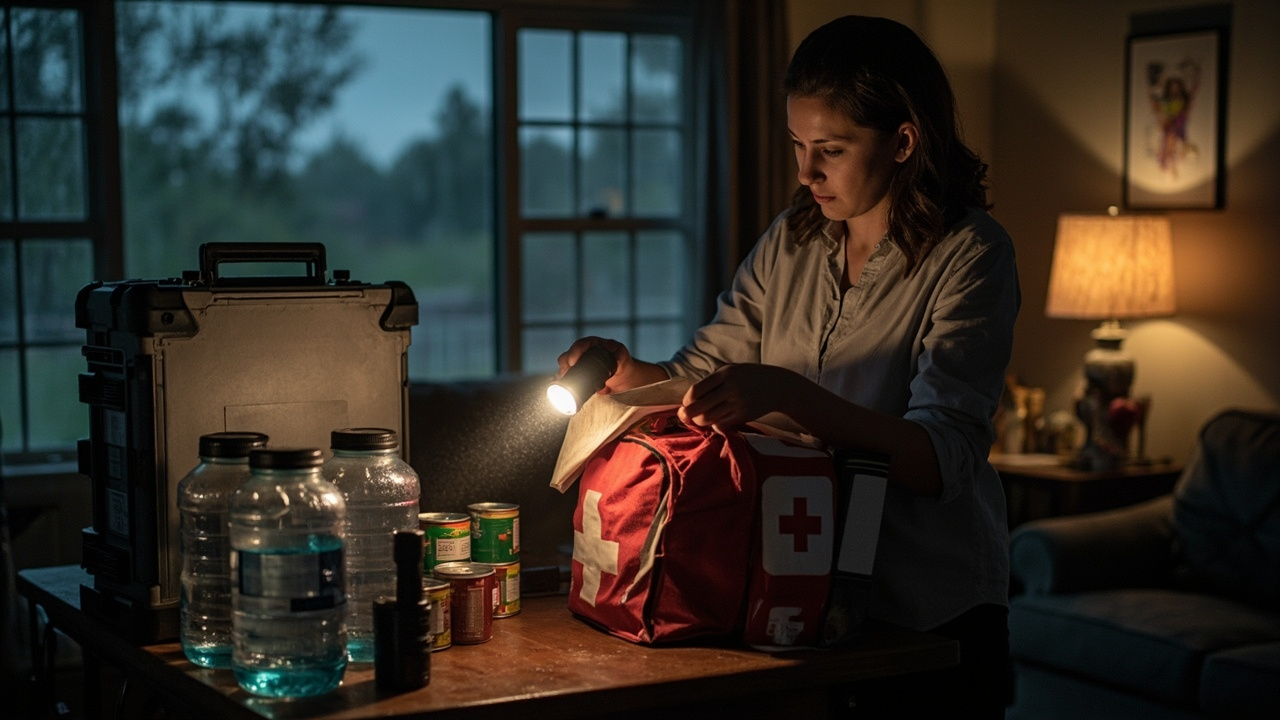
TL;DR: On September 15, 2026, new survey data showed 54% of Americans felt ready for a weather emergency while only 13% had a written emergency plan.
Confidence ran ahead of written plans
According to the report titled Only 13% of Americans Have an Emergency Plan, First Onsite Survey Finds • Disaster Recovery Journal, just over half of adults described themselves as personally ready for a weather emergency, but documented readiness was far lower. The First Onsite Weather and Property Survey put personal readiness at 54% for 2026, kit ownership at 38%, and written-plan ownership at 13%.
That release was timed for National Preparedness Month and was produced by First Onsite Property Restoration with Angus Reid. It pointed to a summer with flooding in Texas and wildfires in the West. In that context, 30% said a weather-related disaster had affected their home or workplace in the previous five years.
Other household steps were more common than written plans. According to the same survey, 56% had reviewed insurance coverage in the prior 12 months, 51% had property documentation backed up and accessible, 31% had added a physical resilience upgrade such as a sump pump or generator, and 55% expressed confidence in local authorities to respond effectively.
Jenny Lindström, SVP, Customer Experience at First Onsite, said community resilience starts with preparedness. The company advised households and businesses to learn local weather risks, assemble a kit, document property, review coverage, and identify where to go if a home became temporarily unlivable.
Ownership and region changed the numbers
Housing status separated respondents. According to the First Onsite survey data, 63% of homeowners felt personally ready for a weather emergency, against 43% of non-homeowners. Kit ownership was 46% for homeowners and 29% for non-homeowners. Written plans were held by 16% of homeowners and 9% of non-homeowners. Backed-up property documentation was reported by 60% of homeowners and 41% of non-homeowners.
Regional answers also differed. In the South, 58% felt personally ready, the highest regional share, while the West was lowest at 49%. The Northeast was at 54% and the Midwest at 51%. Kit ownership was highest in the South at 44% and the West at 41%, compared with 30% in both the Northeast and Midwest.
Written plans were most common in the West at 18%, followed by 15% in the South, 10% in the Northeast and 6% in the Midwest. Insurance reviews in the prior year ranged from 53% in the Northeast to 58% in the West, with 55% in the Midwest and 57% in the South. Accessible documentation ranged from 45% in the Midwest to 53% in the South. Physical upgrades ranged from 30% in the South and West to 35% in the Midwest.
FEMA survey tracked belief, supplies and alerts
The longer federal trend came from FEMA’s National Household Survey as summarized in the 2024 National Preparedness Report, as compiled in the page titled Emergency Preparedness Statistics 2026 - Preparing with Dan. That compilation reported that 51% of adults in the 2023 survey believed they were prepared for a disaster, up from 42% in 2017 and below the 59% high recorded in 2019.
In the same federal survey round, 77% of respondents in cities and rural areas alike thought a disaster would likely affect them in the coming year. Recent action was narrower: 48% had assembled or refreshed emergency supplies during the prior year, 32% had set aside rainy-day savings, and 30% had documented or insured property.
Alert behavior showed another mismatch. According to the compilation, 36% had enrolled for alerts and warnings, while 98% expected to receive real-time alerts from multiple sources. Fewer than 40% said they held savings earmarked for disasters, and about one in four said evacuation would depend on public transportation. Community involvement was reported by 14%.
Exposure to information mattered. According to the same federal-survey summary, 89% had seen preparedness information, and people who had seen it were five times more likely to have completed at least three preparedness actions. Concern about power was elevated, with 63% saying they were very or extremely concerned about energy availability during an emergency.
Weather in 2024 produced 1,084 deaths
The National Weather Service Summary of Natural Hazard Statistics for 2024 counted 1,084 weather-related deaths and 1,482 injuries in the United States, with $18.4 billion in property and crop damage, according to Emergency Preparedness Statistics 2026 - Preparing with Dan.
Heat dominated mortality. The compilation listed 529 heat deaths, close to half of the weather total and more than ten times the 46 deaths attributed to cold. Flash flooding caused 119 deaths and river flooding caused 30. Tropical storms and hurricanes caused 78 deaths, rip currents caused 74, tornadoes caused 52, winter storms caused 22, and lightning caused 14.
Damage was led by tropical systems. According to the same compilation, hurricanes and tropical storms caused $9.3 billion in damage, flash floods caused $3.2 billion, and tornadoes caused $1.7 billion.
Billion-dollar events totaled $182.7 billion
The NOAA National Centers for Environmental Information billion-dollar disaster file, archived after 2024, listed 27 U.S. events in 2024 that each exceeded $1 billion, the second-highest annual count on record, according to Emergency Preparedness Statistics 2026 - Preparing with Dan. Combined losses were $182.7 billion, with 568 deaths.
The 2024 mix included 17 severe storms, five tropical cyclones, two winter storms, and one flood, one drought and one wildfire apiece. Over 1980 through 2024, the file recorded 403 such events, with costs above $2.915 trillion adjusted to 2024 consumer prices and 16,941 deaths. That long-run record averaged about nine events and 376 deaths per year.
Outages averaged 11 hours per customer
Electricity data underscored the energy concern. According to the U.S. Energy Information Administration Today in Energy item from December 2025, based on the Electric Power Annual 2024, the typical U.S. electricity customer logged 11 hours of interruptions in 2024, nearly double the yearly average of the prior decade, as cited in Emergency Preparedness Statistics 2026 - Preparing with Dan.
Three hurricanes drove the total. Beryl, Helene and Milton represented 80% of hours without power in 2024. Major-event interruptions averaged nearly nine hours, compared with about four hours during 2014 through 2023.
For a mother organizing a home, that pattern points to lighting, phone charging, refrigeration, heating or cooling backup, and a one-room plan for the first night. Portable power, stored water, and paper copies of contacts matter when charging and networks fail.
Fires, heaters and carbon monoxide added home risk
Residential fire estimates added a year-round indoor hazard. According to U.S. Fire Administration figures cited in Emergency Preparedness Statistics 2026 - Preparing with Dan, an estimated 343,000 residential building fires occurred in 2024. Cooking accounted for 46.7%, unintentional or careless actions for 10%, heating for 7.9%, electrical malfunction for 7.7%, and intentional fires for 4.7%.
The decade trend was mixed. From 2014 through 2023, residential fires declined 6%, while residential fire deaths increased 5% and inflation-adjusted dollar loss increased 25%, with annual deaths generally between about 2,600 and 2,800. Fires represented only 3.7% of U.S. fire-department responses, while emergency medical and rescue calls represented 65.1%.
Heating equipment deserved selective attention. Portable heaters caused only about 3% of residential heating fires in 2017 through 2019, but the U.S. Fire Administration noted that consequences were substantial relative to that share. On carbon monoxide, Centers for Disease Control and Prevention material cited in the compilation said more than 400 Americans die annually from unintentional non-fire poisoning, with more than 100,000 emergency-department visits and more than 14,000 hospitalizations.
Working alarms on each level, a detector outside sleeping areas, and never running generators, grills or camp stoves indoors align with that risk profile.
Money limits shaped recovery options
Financial data showed limited slack. According to Federal Reserve Board findings in Economic Well-Being of U.S. Households in 2024 from May 2025, as cited in Emergency Preparedness Statistics 2026 - Preparing with Dan, 63% of adults would cover a hypothetical $400 emergency entirely with cash or its equivalent. That share was unchanged from 2022 and 2023 and down from 68% in 2021. The other 37% would borrow, sell something, or could not cover it.
Retirement confidence also slipped. Among non-retirees, 35% viewed their retirement savings plan as on track, down from 40% in 2021.
Displacement costs reinforced the point. According to the First Onsite survey, 47% said they could pay for lodging elsewhere for one month or less if storm damage made a home unlivable, including 17% who could manage for less than one week. Another 13% could manage one to two weeks and 17% about one month. Only 18% could manage several months and 16% more than six months, while 20% were unsure.
What a $200 kit test means for moms
The Preparing with Dan project added July 2026 retail price checks. A FEMA-compliant 72-hour kit for four people was priced item by item at about $200 using the cheapest verified U.S. retail listings, or $50 per person and $16.67 per person per day, with water and food representing $111, according to Emergency Preparedness Statistics 2026 - Preparing with Dan.
Calorie and water math warned against assuming a box alone was enough. A standard 3,600-calorie emergency ration bar provides 1,200 calories daily across three days, compared with a commonly cited need of 1,600 to 2,500, leaving a daily shortfall of 400 to 1,300 calories per person. The best-selling one-person 72-hour kit on Amazon at the time included six 4.25-ounce water pouches, about 25 ounces for three days, compared with Ready.gov’s guidance of one gallon per person per day. The page offered its figures for reuse with a link to the page or original source.