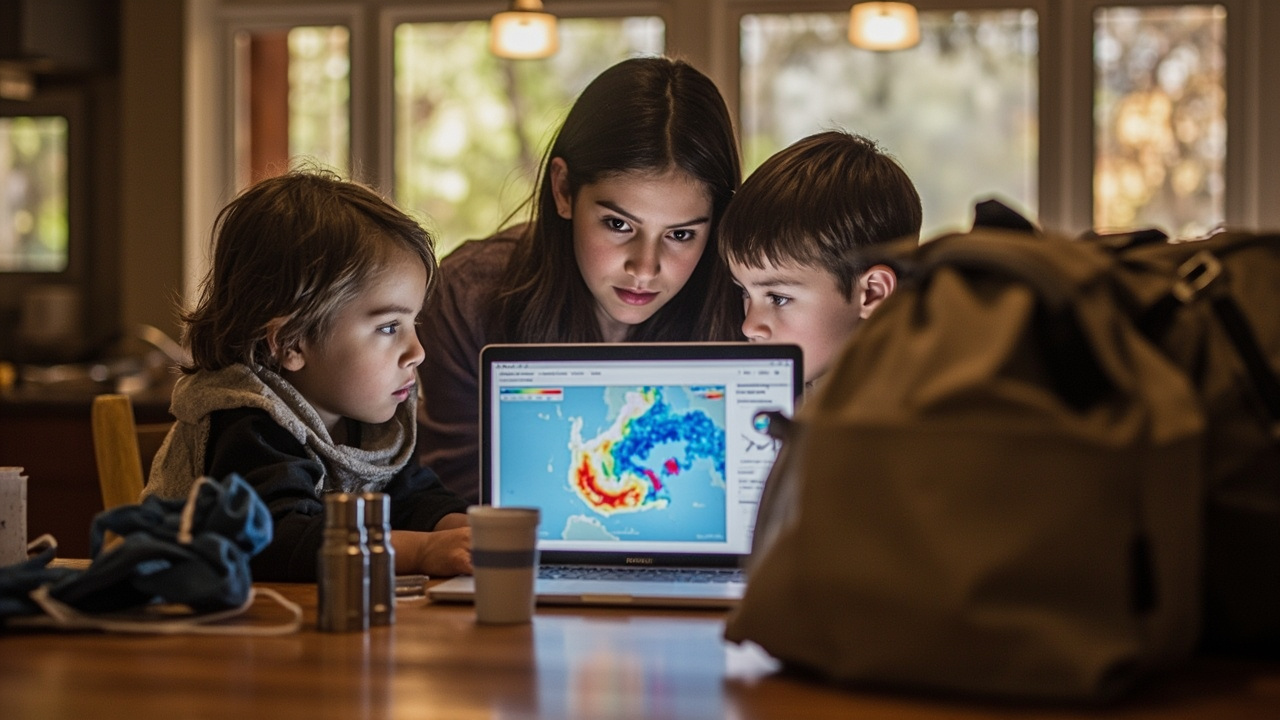
TL;DR: CDC’s Environmental Public Health Tracking Program gives households and local planners free maps, dashboards, and overlays for heat, hurricanes, wildfire smoke, flooding, and air quality to check local hazards, at-risk groups, and nearby resources before, during, and after an event.
Newest verified update anchors this guide
Published, updated, and reviewed on Oct. 20, 2026, the page titled Emergency Preparedness and Response Data and Tools | Tracking Program | CDC states that disasters and emergencies can happen any time and that preparation matters for communities.
That same CDC source describes the provider as CDC’s Environmental Public Health Tracking Program and describes its offer as data tools and resources to help residents prepare for and respond to emergencies.
For Prepper Mom readers, the practical meaning is direct: the Tracking Program is a place to look up local conditions, compare places, and organize family and neighborhood plans around the same information public-health professionals use before, during, and after an emergency.
What the Tracking Network brings together
According to Emergency Preparedness and Response Data and Tools | Tracking Program | CDC, CDC’s Environmental Public Health Tracking Network brings together health, environmental, hazard, and population data from national, state, and local sources.
The page explains that combined data can help communities identify threats, understand who may be at increased risk, plan resources, and take action to help prevent illness, injury, and death.
The listed hazard coverage includes extreme heat, hurricanes and tropical storms, wildfires and smoke, flooding and heavy precipitation, poor air quality, and other natural disasters and public health emergencies.
That breadth matters for a family plan because one property can face more than one threat across seasons. A household can review heat information for summer, storm information for hurricane season, and smoke and air-quality information for fire season in the same system.
How professionals are expected to use local data
The companion page titled Preparedness & Response | Tracking Program states that knowledge of a community’s local infrastructure, vulnerabilities, and resources enables public-health professionals to quickly establish priorities and take proper actions during emergency or disaster response.
That CDC source lists six preparedness and response uses for Tracking Network datasets: identifying community-specific threats and hazards; identifying populations at increased risk; identifying community vulnerabilities; determining resources needed for public-health response or public safety; informing public-health actions that could lessen or prevent illness, injury, and death; and evaluating possible scenarios based on time, place, and conditions.
For a preparedness-minded household, those six uses translate into a checklist: know the likely threat, know who in the home or street may face higher risk, know where weakness exists, decide what supplies and help may be required, choose protective actions, and think through how time, place, and conditions change the scenario.
The same source notes an important limit: the data are based on total populations, rather than individual members of a particular population. Families should therefore treat the maps as neighborhood context, not as a medical forecast for one person.
Datasets to review for household and street-level planning
The Preparedness & Response | Tracking Program source lists preparedness and response dataset groups covering demographics, health status, heat vulnerability and preparedness, households, internet access, land cover, land use, medical infrastructure, Social Vulnerability Index, socioeconomic status, vulnerability and preparedness for precipitation and flooding, and wildfires.
The page describes a custom version of the Tracking Network’s Data Explorer tool that includes those indicators. It says to use it to access data to support community assessments and decision-making during and after emergency situations.
From a practical standpoint, the household-relevant groups are easy to group by question. Demographics, households, socioeconomic status, and Social Vulnerability Index help answer who lives nearby and who may need extra help. Health status, heat vulnerability and preparedness, and precipitation and flooding vulnerability help answer what health and hazard pressures overlap. Internet access, land cover, land use, medical infrastructure, and wildfires help answer how people receive warnings, how the landscape behaves, and where care is located.
Emergency Preparedness and Response View: the filtered starting point
CDC offers a filtered starting point called the Emergency Preparedness and Response View in the Data Explorer for data commonly used for hazard assessment, emergency planning, and recovery, according to Emergency Preparedness and Response Data and Tools | Tracking Program | CDC.
The CDC description says this special view provides focused and centralized information to support planning and decision-making during an emergency. It also says it enables quicker assessments of the breadth and variety of community resources and vulnerabilities.
The detail page titled Emergency Preparedness & Response View adds that the view showcases content areas and measures commonly collected and used in hazard assessment and post-emergency recovery efforts. It calls the view a filtered version of the Data Explorer tool.
That detail source says selected measures highlight indicators of specific hazardous events, including extreme heat events, projected precipitation, and air quality. It also says the view includes relevant community characteristics and infrastructure data, with examples including household composition and land use.
How to select an indicator
The Emergency Preparedness & Response View source explains the same basic workflow as the Data Explorer, but with more tailored content areas and measures.
To use the query panel, first select a content area of interest followed by an indicator, then select a specific measure to visualize on a map. Next, select how to visualize the information in the Geography Type drop-down menu. Then select a specific geographic level or area and a time frame for the data. Some measures include additional view options under Advanced View.
That sequence helps a beginner avoid random clicking. Choose topic first, then exact measure, then place and time.
Map layers that add live context
The Preparedness & Response | Tracking Program source states that users can add important contextual information to Data Explorer maps, including overlays of real-time data such as weather radar, surface smoke, and active Atlantic cyclones.
The same source states that users can also add points of interest, including day care centers and public schools, health care facilities, National Shelter System Facilities, and many more.
The Emergency Preparedness & Response View source gives the menu logic in more detail. It says visualizations can be customized by clicking on the map menu. When clicked, three icons appear.
Map Options, Legend Options, and Link Maps
Under Map Options, the source lists four customization choices: add a point-of-interest layer on top of the indicator being mapped; add an overlay layer with real-time environmental data; change the view of the map background layer; or change the boundary overlay.
Point-of-interest examples include point locations of hospitals, schools, water bodies, and federal property. Real-time overlay examples include current radar and active Atlantic cyclones. The source notes that an exclamation point will appear on the map if all points of interest are not being displayed, and it directs users to zoom in to view additional points.
Under Legend Options, the source says users can change the color scheme of the map, adjust the number of break groups, or change the classification type among equal intervals, quantiles, and natural breaks. It notes those options allow map customization, which is useful if exporting an image of a created map.
Under Link Maps, the source says that when visualizing two indicators side by side in the two available maps, selecting link maps will ensure that the zoom level across the two maps matches. It also says that hovering over a particular area will show detailed information for the same area in both maps simultaneously.
Four worked map combinations to copy
The Emergency Preparedness & Response View source describes four worked combinations that families and neighborhood groups can reproduce.
First, flood hazard areas with current radar overlay. The source states that during periods of severe weather and heavy precipitation, visualizing the density and distribution of populations living in flood hazard areas with real-time radar projections can assist in tailoring safety messages to impacted populations and preparing shelter resources as situations develop. Its example pairs number of people and housing units within FEMA-designated flood hazard area with the current radar overlay layer.
Second, asthma prevalence with current surface smoke. The source states that people with respiratory issues, like asthma, face increased risk of respiratory hazards and adverse outcomes associated with wildfire smoke. It states that during the event and in the aftermath of a wildfire, visualizing the geographic spread of asthma burden in the affected area will enable health authorities to begin targeted health interventions and easily provide hospital resources. Its example compares prevalence of adult asthma with the geography of current surface smoke.
Third, outdoor air quality with nursing-home locations. The source states that visualizing air quality along with points of interest where groups with higher risk of health impacts are concentrated, such as nursing homes, could be useful in planning for allocation of hospital and other care resources and sharing prevention messages for harmful ambient air quality. Its example pairs forecasted air quality with the distribution of U.S. nursing homes point-of-interest layer.
Fourth, flood hazard areas with social vulnerability. The source describes the Social Vulnerability Index as a useful tool for identifying communities at greater risk during and after disasters. It states that, due to increasing frequency of severe weather events, comparing SVI distribution to specific hazard vulnerabilities can be useful in creation of long-term mitigation strategies and context-specific disaster plans. Its example pairs number of people living within FEMA-designated flood hazard area with county-level Social Vulnerability Index overall rank.
Hurricane Dashboard: storms plus local impacts
CDC’s Hurricane Dashboard is presented as a tool to support preparedness, response, and recovery planning, according to Emergency Preparedness and Response Data and Tools | Tracking Program | CDC.
That source says users can explore active and recently active storms along with information about affected populations, health, environmental conditions, critical facilities, and power outages.
For a household, that combination supports practical questions around evacuation timing, sheltering, medical needs, and outage readiness. Storm track alone does not show who is affected, what facilities are nearby, or where power is out. The dashboard is described as bringing those layers together.
HeatRisk Dashboard and Heat and Health Tracker
Tracking provides heat and health data that can help communities understand local heat risks and plan actions to protect health, according to Emergency Preparedness and Response Data and Tools | Tracking Program | CDC.
The same source describes CDC’s HeatRisk Dashboard as allowing people to access important heat and health information in an easy-to-use, intuitive, mobile-friendly interface. It says the dashboard provides important heat and health information alongside CDC’s new clinical guidance materials for people at higher risk from heat-related health effects who may need to take more protective actions.
The Preparedness & Response | Tracking Program source separately describes the Heat and Health Tracker as a dashboard with local, timely data and information to help communities prepare for and respond to extreme heat events.
A family can use the mobile-friendly format during a heat event to check local risk and review guidance for higher-risk members. The source does not prescribe individual medical steps; it points users to the heat and health information and clinical guidance materials inside the dashboard.
Wildfire smoke overlay: three clicks in Data Explorer
Wildland fires can affect air quality in a community, and Tracking’s Data Explorer has a tool that allows users to visualize real-time wildland fire smoke with a smoke layer overlay, according to Emergency Preparedness and Response Data and Tools | Tracking Program | CDC.
That CDC page lists the workflow as visiting CDC’s Data Explorer and selecting a data set; clicking the blue hamburger menu icon on the upper right corner of the map; and clicking on the gear icon and clicking on Overlay Layer and Surface Smoke to view the real-time surface smoke layer.
The page heading presents the task as checking wildfire smoke levels near you right now. That makes the smoke overlay one of the fastest checks in the toolkit when skies look hazy or a distant fire is in the news.
Radiation and at-risk-group planning resources
Beyond weather hazards, the Preparedness & Response | Tracking Program source lists CRC SimPLER, expanded as Community Reception Center Simulation Program for Leveraging and Evaluating Resources, and describes it as a planning tool for radiation emergencies.
The same source also lists Planning for an Emergency: Strategies for Identifying and Engaging At-Risk Groups.
Together with the map tools, those entries show that CDC’s preparedness collection covers both place-based hazard mapping and population-based planning for people who may need targeted outreach before an evacuation or shelter operation.
How Prepper Mom readers can use this without overload
Start with the Emergency Preparedness and Response View when time is short because it already filters the Data Explorer to content commonly used for hazard assessment and post-emergency recovery, as described in Emergency Preparedness & Response View.
Then add one overlay and one point-of-interest layer tied to the current concern, such as radar over flood-hazard population data during heavy rain, or surface smoke over asthma prevalence during fire season.
Finally, open the hazard-specific dashboard for the active threat: the Hurricane Dashboard for active and recently active storms with population, health, environmental, facility, and outage context, or the HeatRisk Dashboard for local heat and health information in a mobile-friendly display, both as described in Emergency Preparedness and Response Data and Tools | Tracking Program | CDC.